Viewport Control
The viewport is the area of the map that is currently being displayed. By default, MapWeave shows the full map provided by your adapter, but also allows users to control the viewport by providing bounds or a view.
Bounds
In MapWeave, bounds describe a rectangle that defines the maximum extent of a set of geographical data (network, observations or GeoJSON) by the latitude and
longitude of its northeast and southwest corners. In the image below and orange rectangle
represents the bounds of the data, which are specified by the LngLatBounds object.

Fit Bounds
It is often useful for the viewport to only show the area of the map that contains data. In the below example, the stations for the Metro 1 line of the Paris Metro are shown as nodes in the network layer.
Set the viewport to fit to the bounds of the content using fitBounds(). If no FitBoundsOptions are passed to fitBounds(), the viewport includes all
the data for all layers in the map and applies auto padding.
mapweave.fitBounds();
A visual representation of the bounds of the data is shown with the orange GeoJSON rectangle. The distance between
the orange rectangle and the edge of the viewport is the padding.
MapLibre fitBounds()
| Mapbox fitBounds()
| Standalone fitBounds()
| FitBoundsOptions
Get Bounds
It's also possible to show only a subset of data in the viewport. The bounds of layers or items within layers are found with the getBounds() layer methods.
Using the same Paris Metro data, getBounds() is used to set the viewport to show only the four
stations closest to The Louvre Museum.
Once we have the bounds of the stations, they are passed to fitBounds() to set the viewport with a padding of 20 pixels.
// get the bounds of the stations
const louvreBounds = networkLayer.getBounds([
  'Concorde',
  'Tuileries',
  'Palais Royal - Musée du Louvre',
  'Louvre - Rivoli',
]);

// pass the bounds object to fitBounds
mapweave.fitBounds({ bounds: louvreBounds, padding: 20 });
Network Layer getBounds()
| Observations Layer getBounds()
| GeoJSON Layer getBounds()
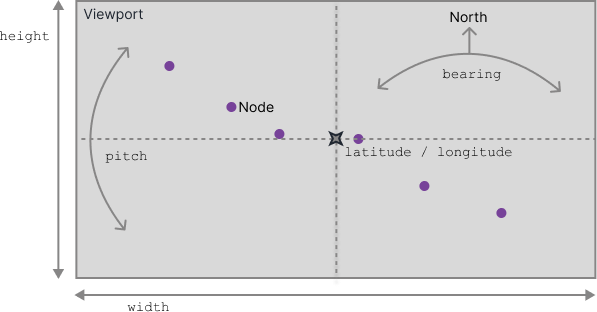
View
MapWeave also allows direct control of the viewport by passing a ViewState object to the view() method.
The ViewState specifies the latitude and longitude of the center of the map as well as the zoom level, pitch and bearing.
MapWeave will return a SizedViewState object using the same method, which includes the width and height of the viewport in pixels.
Interact with the map below using zoom (scroll), pan (click + drag) or rotate (ctrl + click + drag) to see how the SizedViewState changes.
MapLibre view()
| Mapbox view()
| Standalone view()
| ViewState
| SizedViewState